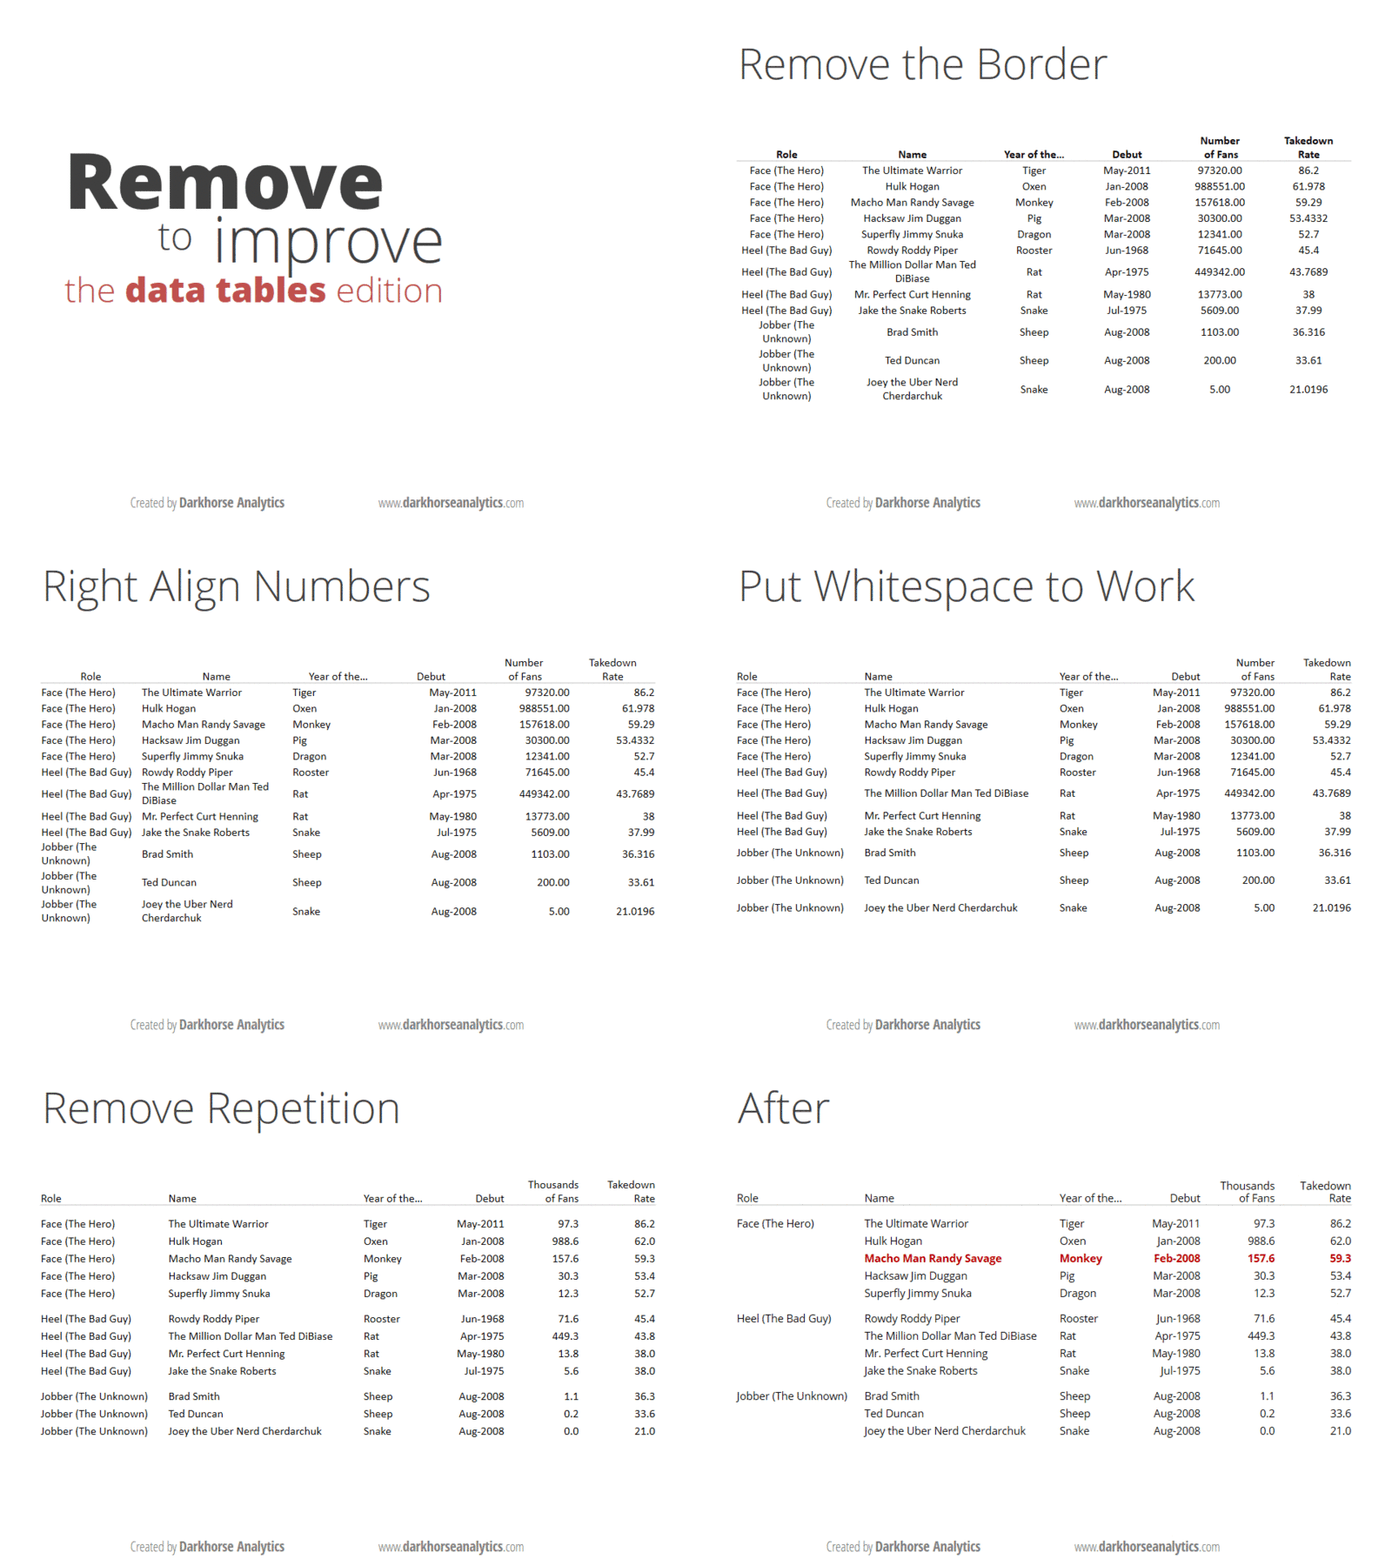
We received a lot of attention for our Data Looks Better Naked post. People got bored on Christmas Eve and some interesting searches for Star Trek somehow landed them on our page. Now their charts look better. The principles outlined in that article aren't just for charts, though. You can apply them to your data tables with similar improvements in readability and aesthetics. To paraphrase Edward Tufte, too often when we create a data table, we imprison our data behind a wall of grid lines. Instead we can let the data itself form the structure that aids readability by making better use of alignment and whitespace.
In the gif below we start with a table formatted similar to one of Excel's many styling options which, much like the chart styles, do nothing to improve the table. Progressive deletions and some reorganization deliver a clearer and more compelling picture.
As with charts, rather than dressing up our data we should be stripping it down. For more information on table design, you can read Chapter 8 of Stephen Few's Show Me the Numbers. My apologies to any true fans of 80's wrestling, the stats below, much like the ring rivalries, are entirely fabricated.
The slide deck for viewing at your own pace:


