Challenge
The Alberta Government together with the University of Alberta wanted to make environmental & public health data more accessible to both analysts within the government and the public at large. They approached us to first visualize water testing data collected throughout the province.
Solution
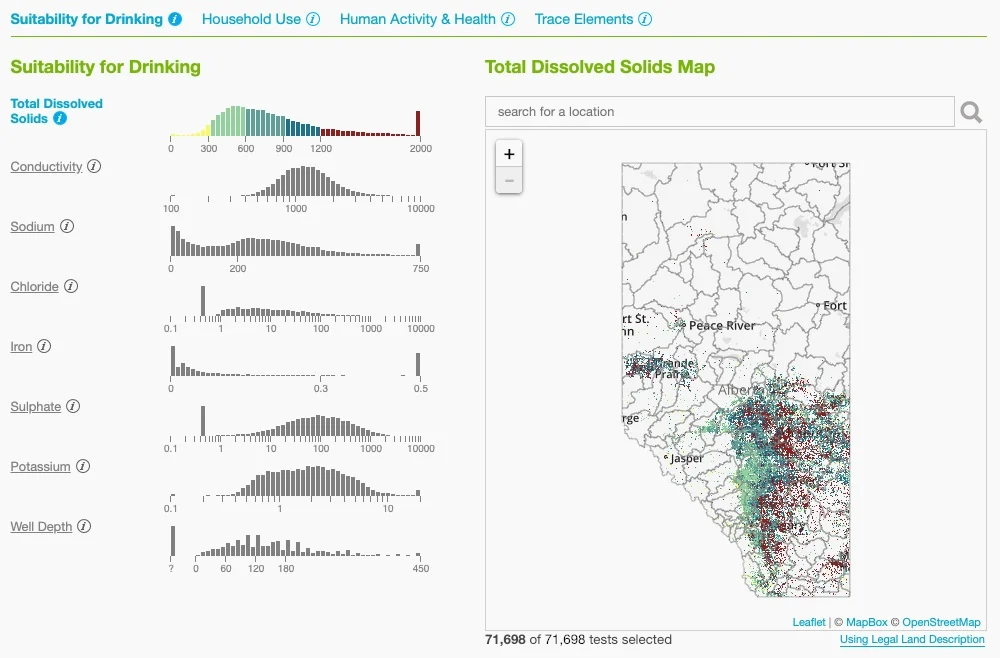
We developed a site that made accessible the tens of thousands of water testing results visualized across the province with the capacity to zoom down to individual tests performed at each location. Filters provide a glimpse into how different testing measures correlate with one another and change geographically.
That solution lead to more work visualizing cyanobacterial blooms, mercury in fish, fish advisories, and public health risk factors as well as a site to house all these tools.
Result
The Alberta government now has an interactive platform to further engage analysts and the general public in the understanding and interpretation of environmental monitoring and public health data. The visual tools ensure the data isn’t just open but also accessible and useful.


