Inform Decisions to Better our World
Make real change possible by helping stakeholders engage with data.
Economic policy is typically based on last year’s data. This project aggregates detailed economic data from private sources daily so that planners can design granular and timely interventions.
How healthy are the people within a community? What actions can be taken to improve their overall health? This site presents these insights to a community and allows users to create a custom, printable report for dissemination.
Humanize Complex Data with Compelling Stories
Lead people through complex data landscapes to find meaning and inspiration.
We collaborated with the Economic Policy Institute to reimagine the State of Working America Data Library, empowering researchers, policymakers, and the public with the tools needed to understand and address the challenges facing America's workforce.
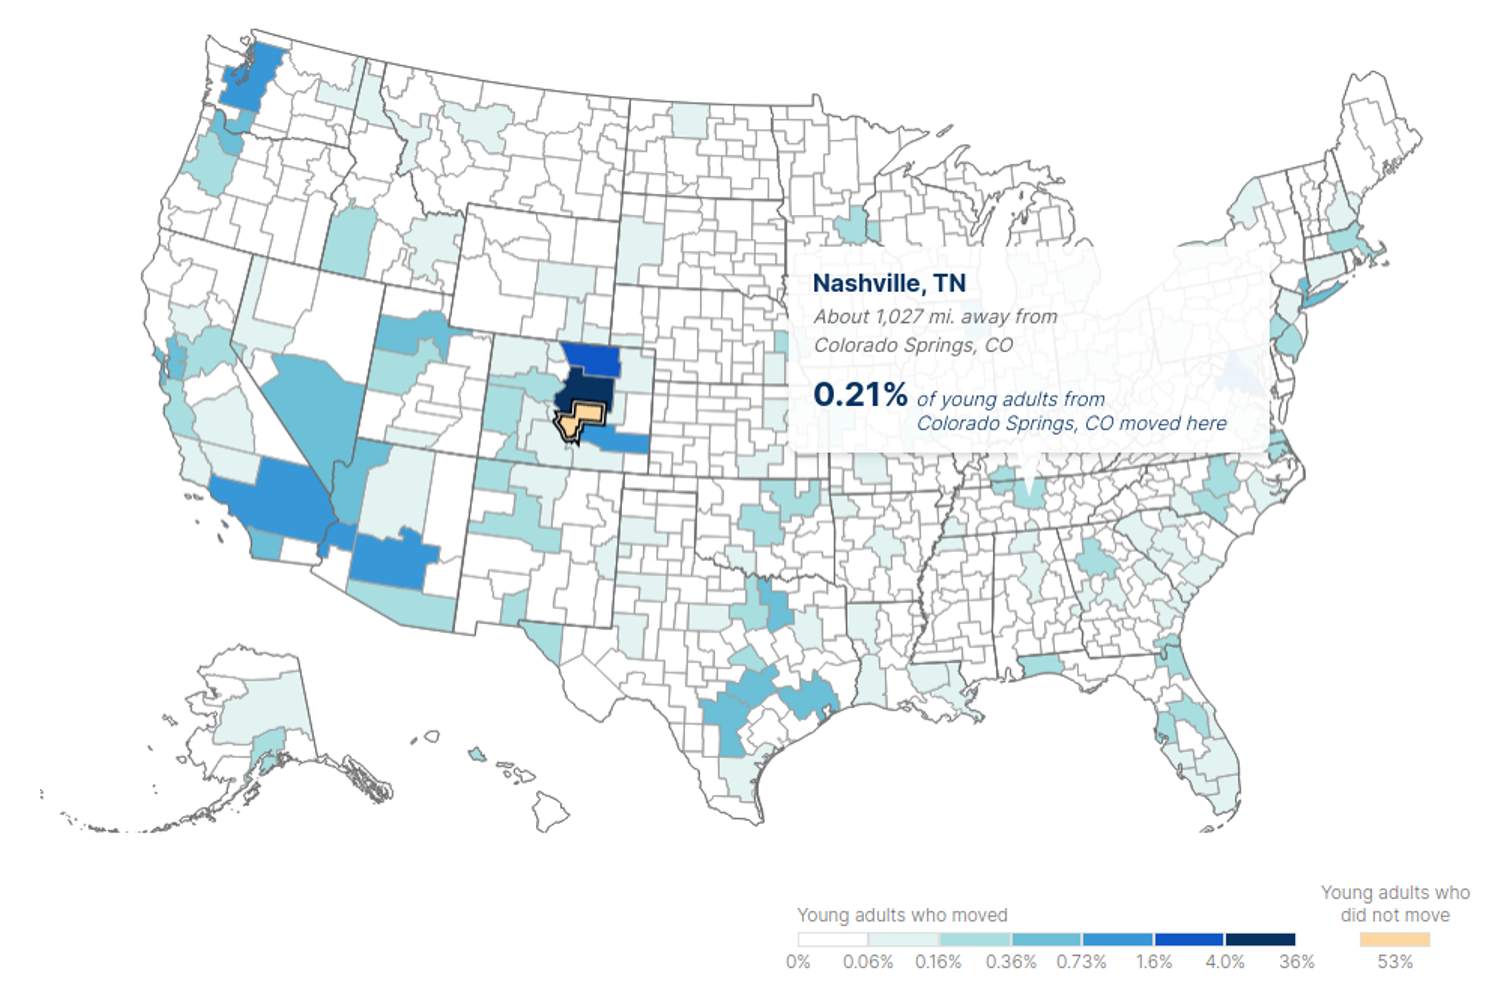
The neighborhood where a person grows up has a long-lasting impact on a person’s opportunities. This project combines hundreds of millions of data points and explores the roots of poverty.
How is the United States doing compared to the year before? The State of the Union in Numbers highlights key metrics of change for everyday Americans.
Engage Audiences with Novel Experiences
Show insights that standard charts cannot convey.
Does a team’s total player income have an impact on whether or not they will win the Stanley Cup? What about penalty minutes?
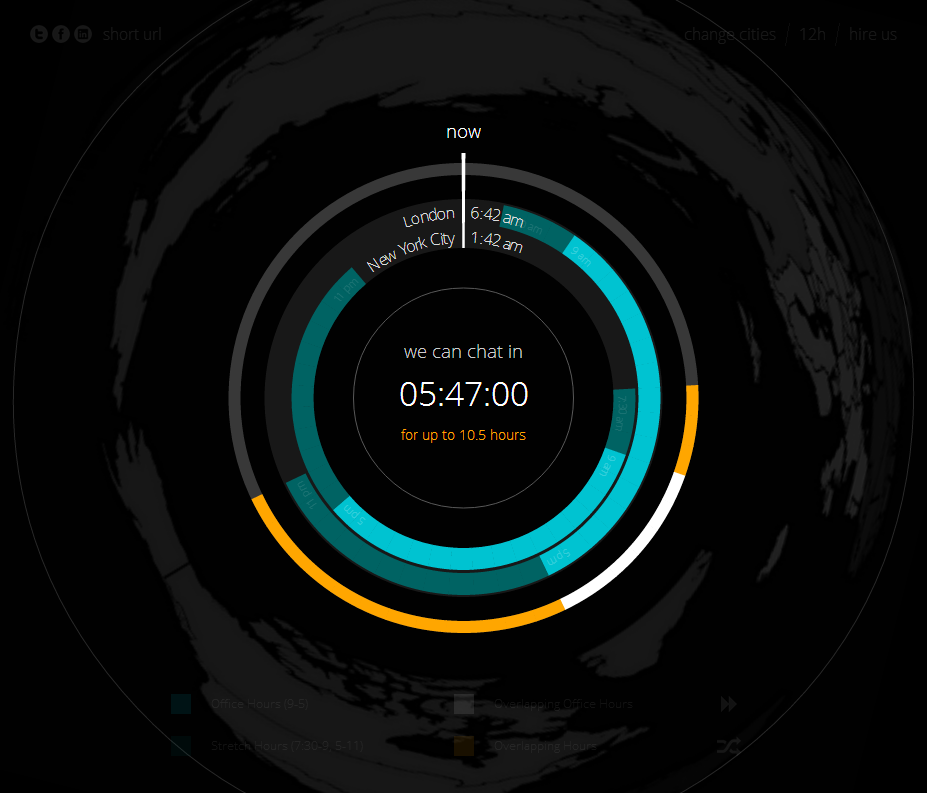
It can be especially difficult to find a suitable time to meet online when people live on different continents. This tool greatly simplifies this task.
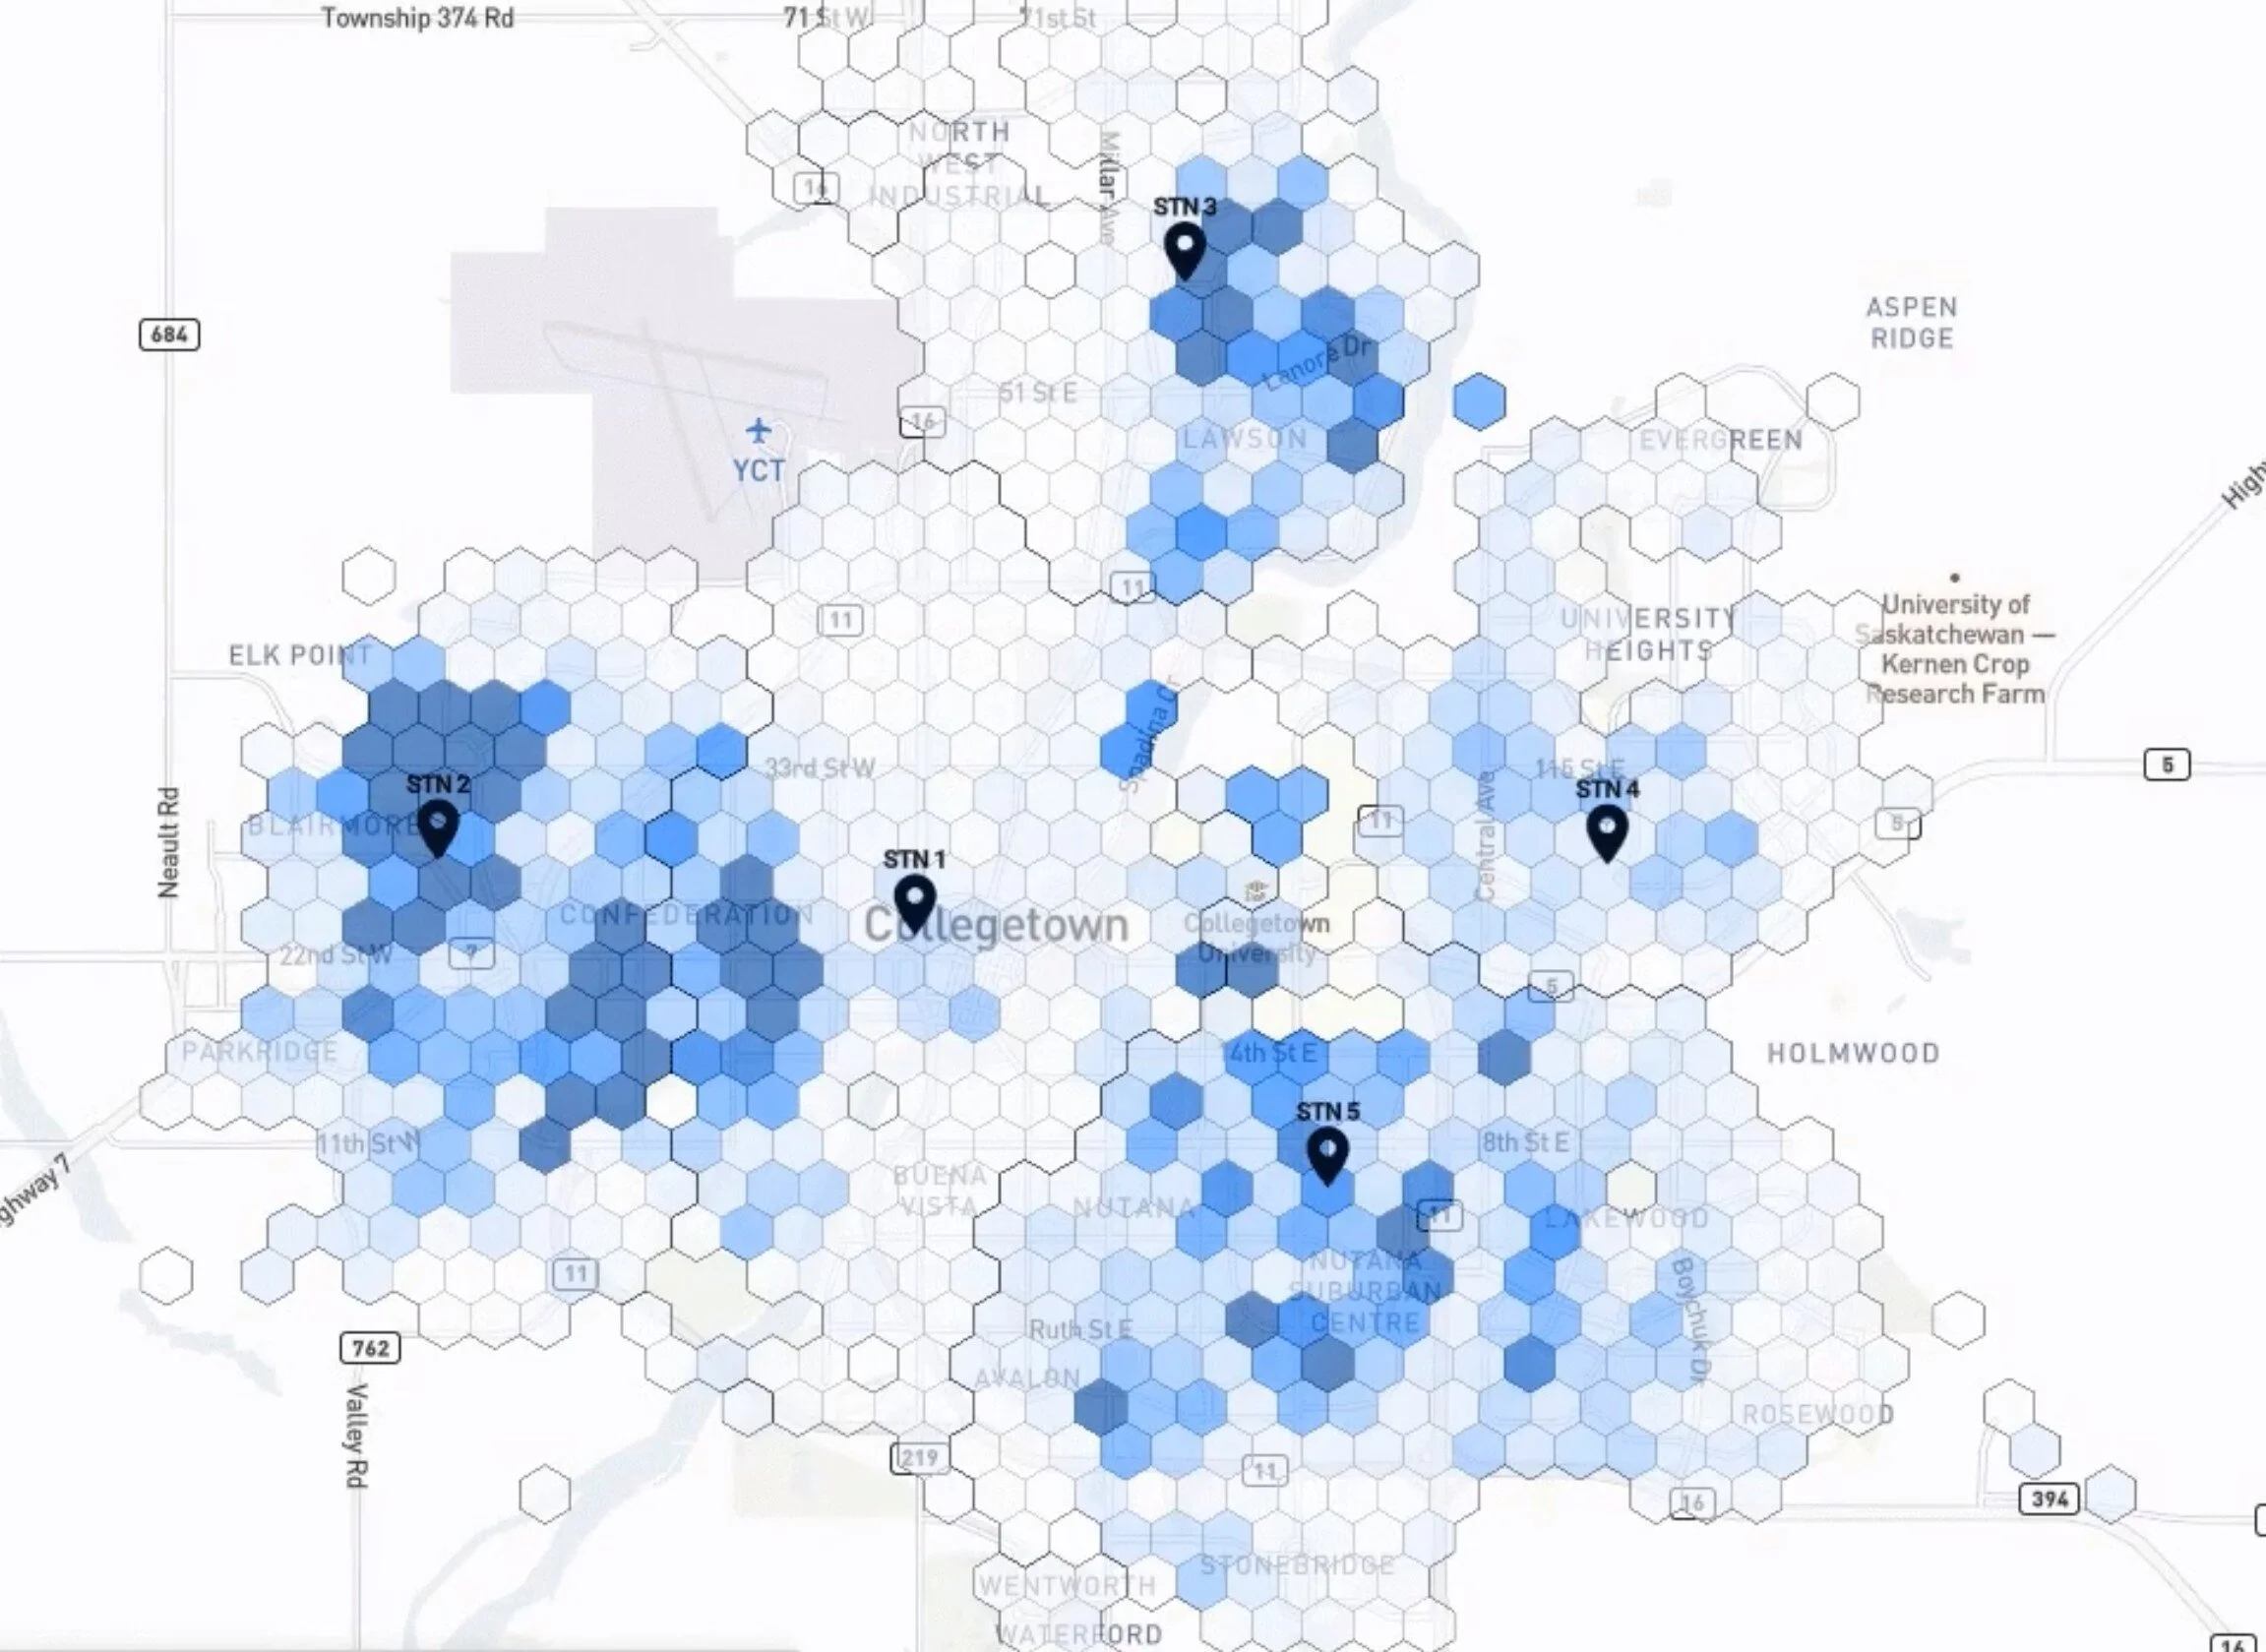
Help municipalities allocate stations, emergency vehicles, and front-line personnel to reduce risk, improve response times, and save lives.














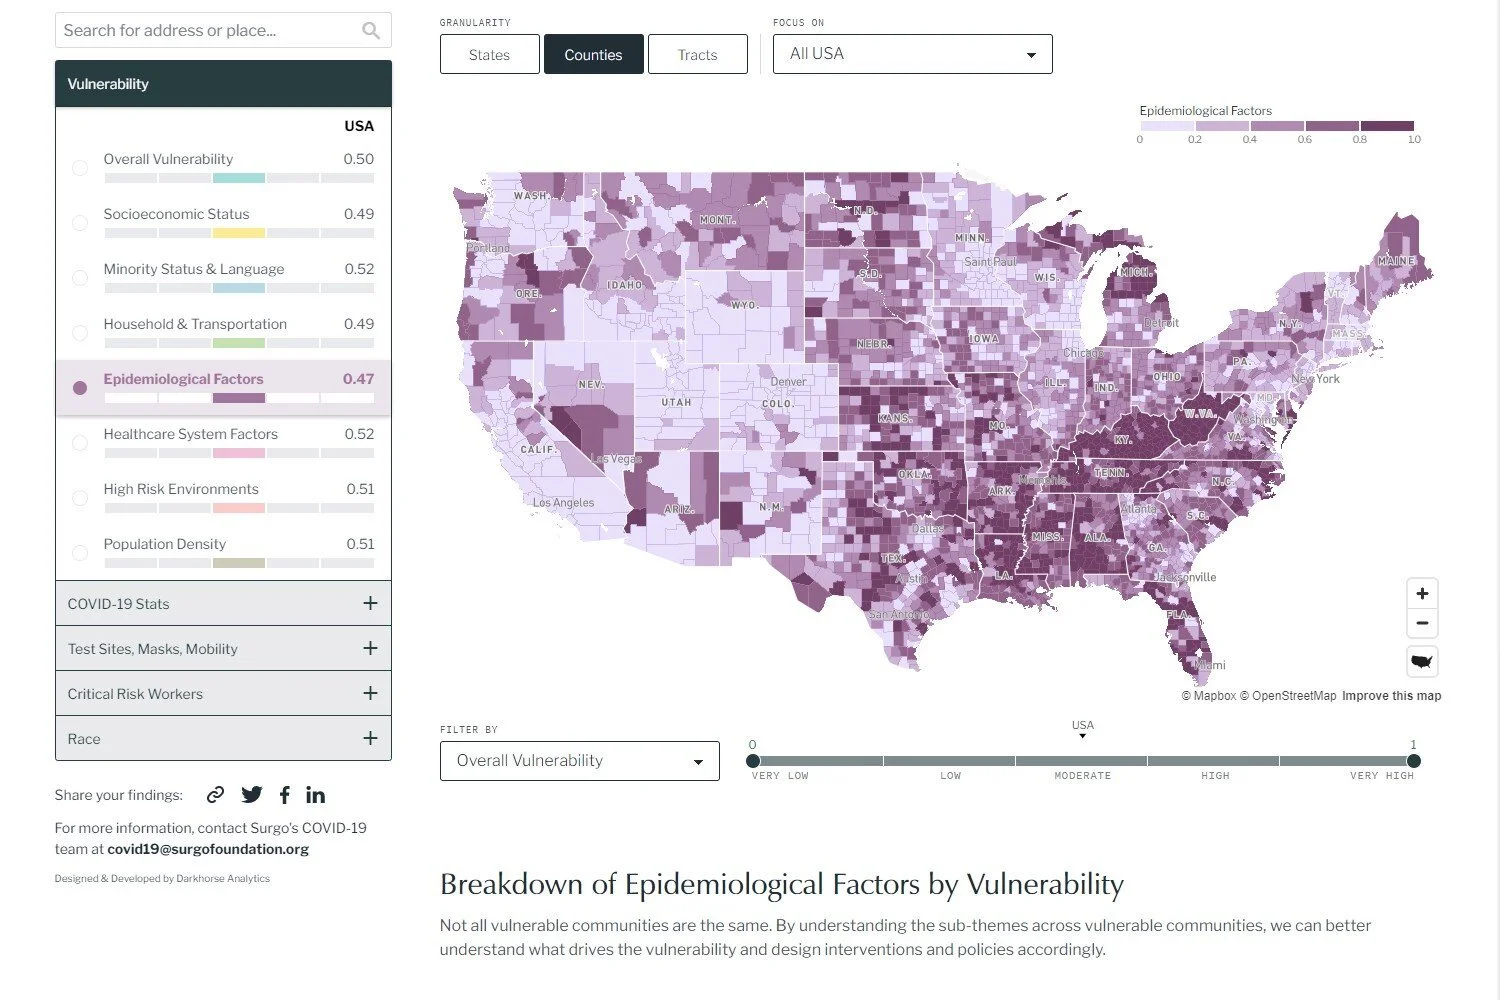

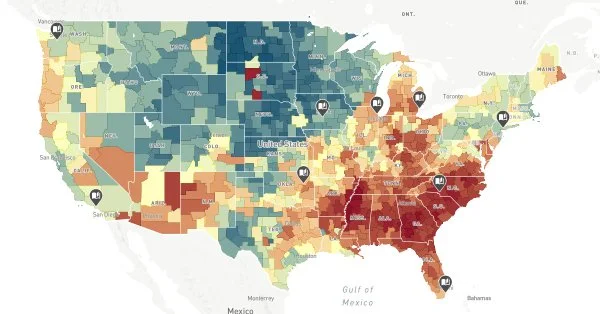






Visualizing 184 indices across 70k+ census tracts to pinpoint long-term health, social, environmental and economic conditions that shape a community’s ability to withstand climate threats.