

Challenge
We were approached by professors from Harvard and Brown University, looking to visualize their research tracing the roots of poverty and incarceration back to the neighborhoods in which children grew up. With data points covering every tract in the US, we were tasked with developing a tool that would communicate the data’s insights into how neighborhoods shape children trajectories.
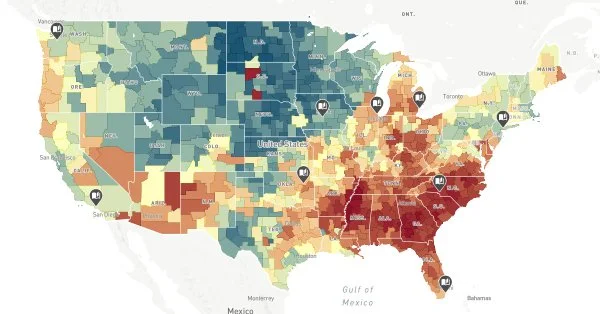
Solution
With geography being the key element of their research we knew a map would be the focus, but care had to be taken to ensure an audience with a wide variety of skill sets could easily and quickly access the results of the research without being overwhelmed. The introduction to the tool keyed in on the primary outcomes from their research, while more advanced metrics and features are tucked away but still accessible to power users.
Scrolling stories walk viewers through many of the key findings from the research. A simple scrolling interaction drives the tool, flying to key locations, highlighting the results, and also educating the viewer on how to use the tool for their own inquiries.
Result
Policy makers, non-profits, and the general public now have access to a powerful tool helping them develop scalable policy solutions that will empower families throughout the United States to rise out of poverty and achieve better life outcomes.